Real-Time KPI Dashboards for Predictive Business Intelligence
Business Intelligence Dashboards help leaders monitor business performance continuously, detect risks earlier, and act before small issues become larger revenue, retention, or operational problems. TDT Analytics designs live KPI dashboards that unify operational, financial, customer, and sales data into a single source of truth — then connects those dashboards to predictive analytics, automated alerts, trend analysis, and drill-down views. Instead of only showing what happened, TDT dashboards help teams understand what is changing, where action is needed, and which decisions can improve business performance.
Turn Business Data Into Immediate Insight
Most organizations are still forced to manage performance through reports that arrive after issues have already started to affect the business. Live KPI dashboards change that by turning operational and financial data into continuous visibility.
That allows leaders and teams to monitor performance as it evolves, identify anomalies earlier, and take action before small issues become bigger business problems.
- A single source of truth vs. fragmented spreadsheets across teams
- Revenue and performance trends as they emerge
- Operational risks before they affect performance
- Customer behavior changes as they emerge
- KPI movement across teams, functions, and regions
- The signals leaders need to act earlier
Dashboard Capabilities Built for Action
TDT designs live KPI dashboards to help leaders and teams monitor performance continuously, investigate issues earlier, and act with greater confidence across the business.
How Live Visibility Improves Business Performance
How TDT Dashboards Work
Integrated Business Data
Operational, financial, and customer data are brought together into a single source of truth — one centralized database that replaces fragmented Excel spreadsheets and eliminates version conflicts.Live KPI Monitoring
Key indicators are monitored continuously, helping teams spot changes, trends, and anomalies as they emerge.Faster Business Action
Teams can identify issues earlier, align around the same metrics, and respond before performance problems grow.Business Outcomes
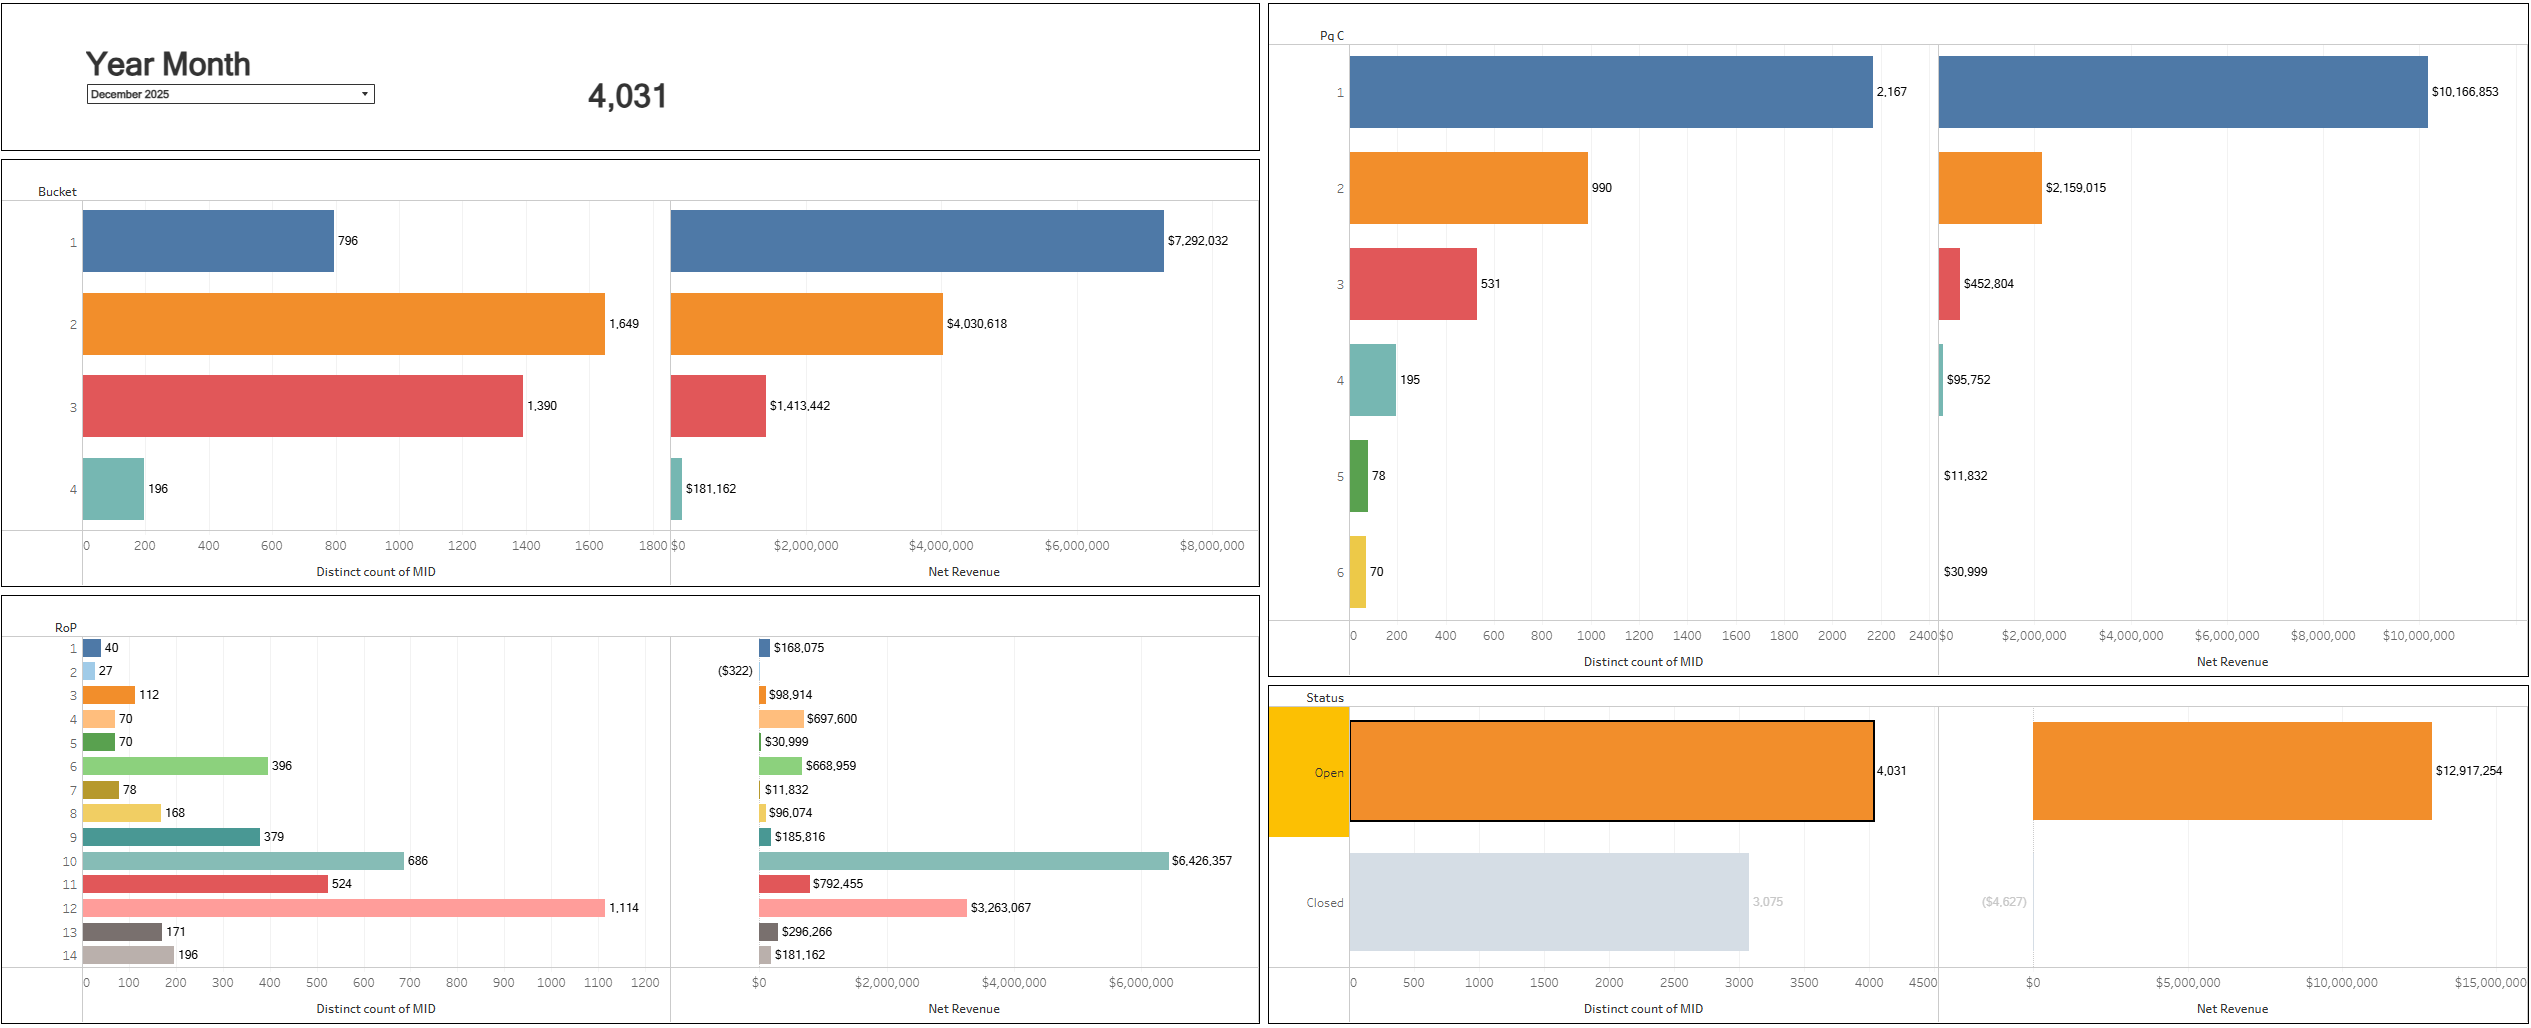
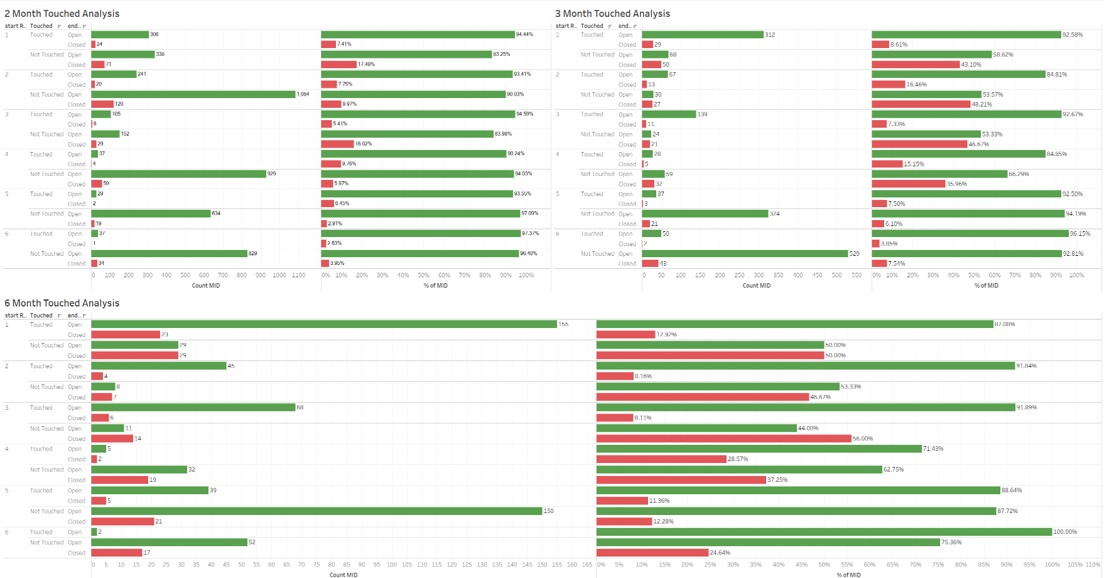
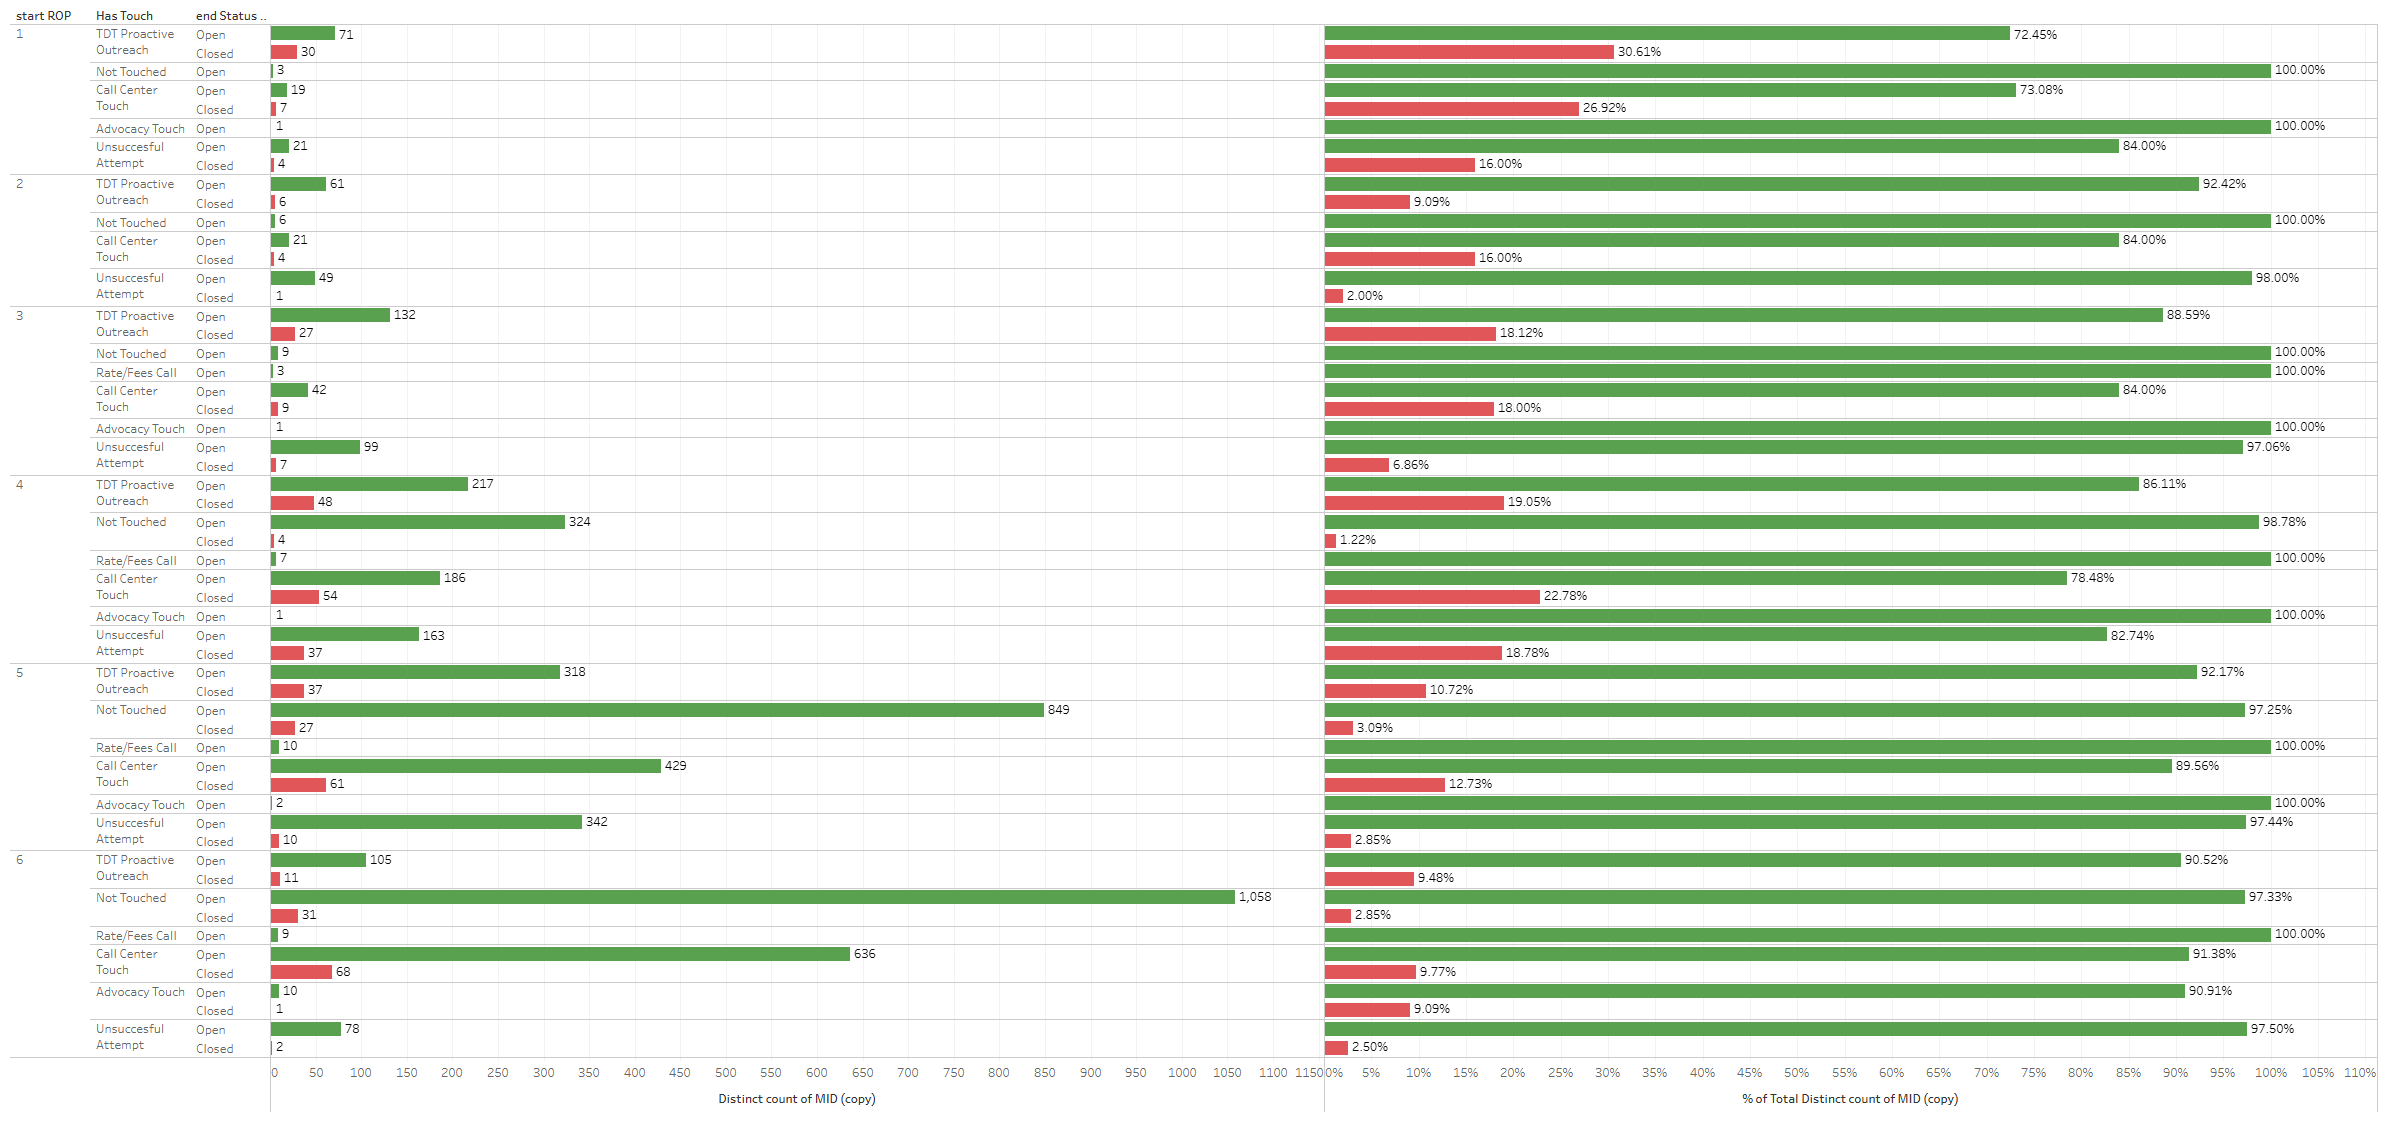
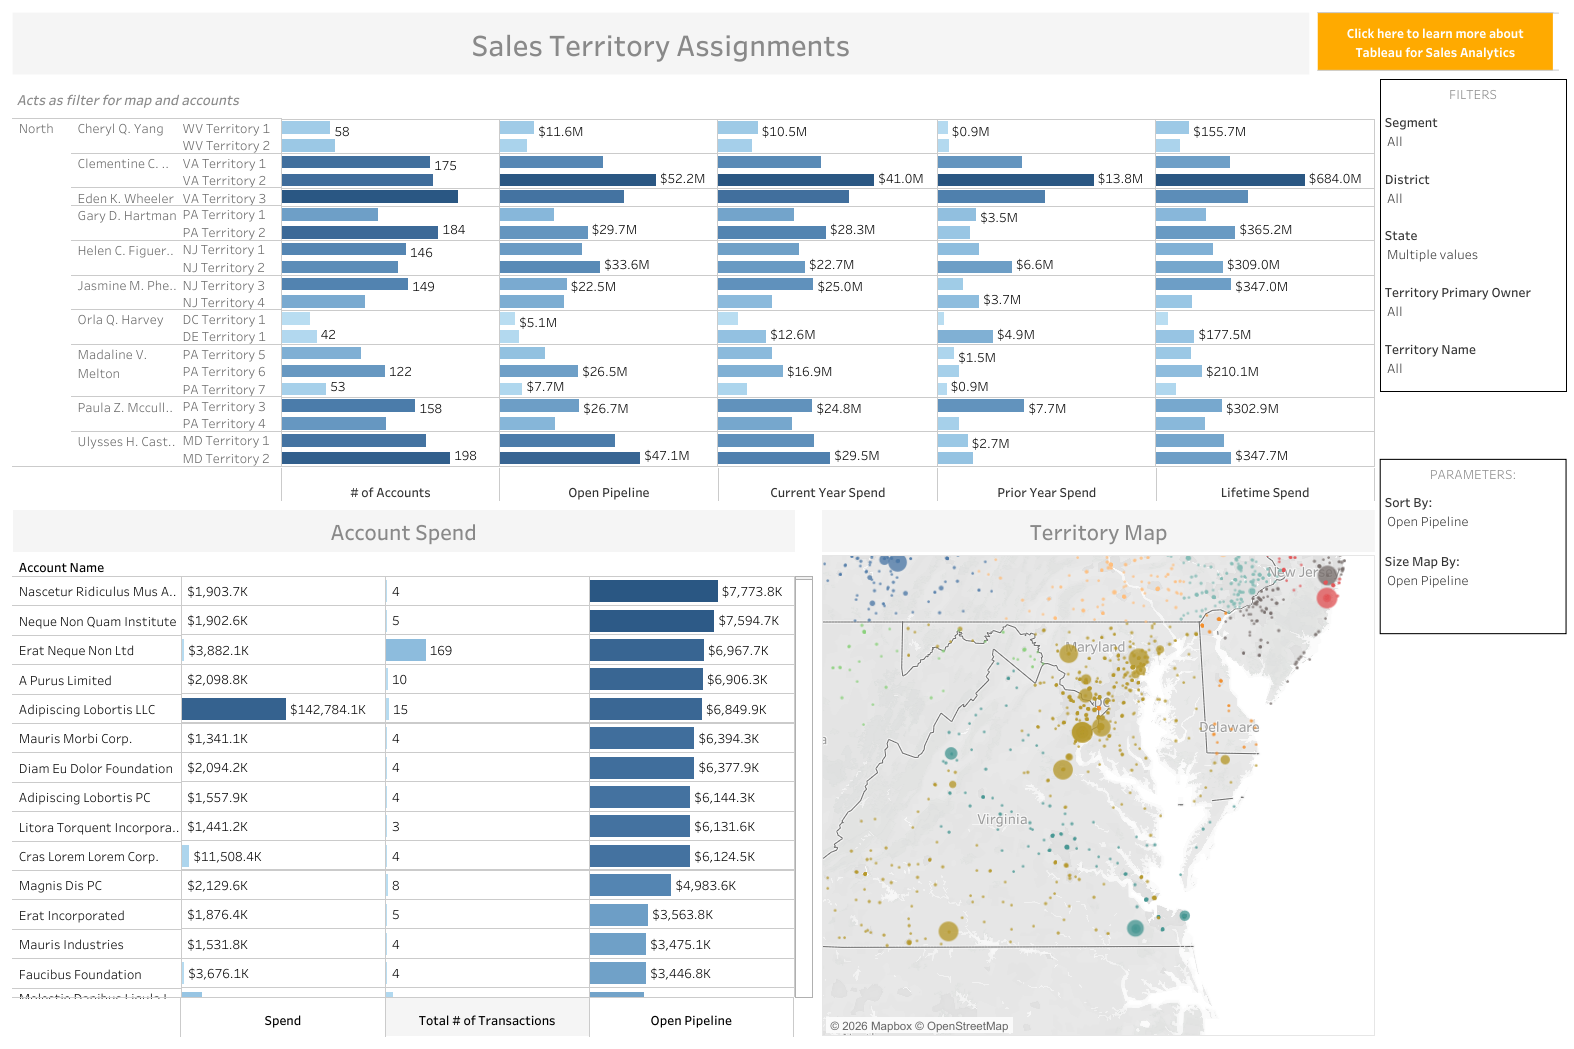
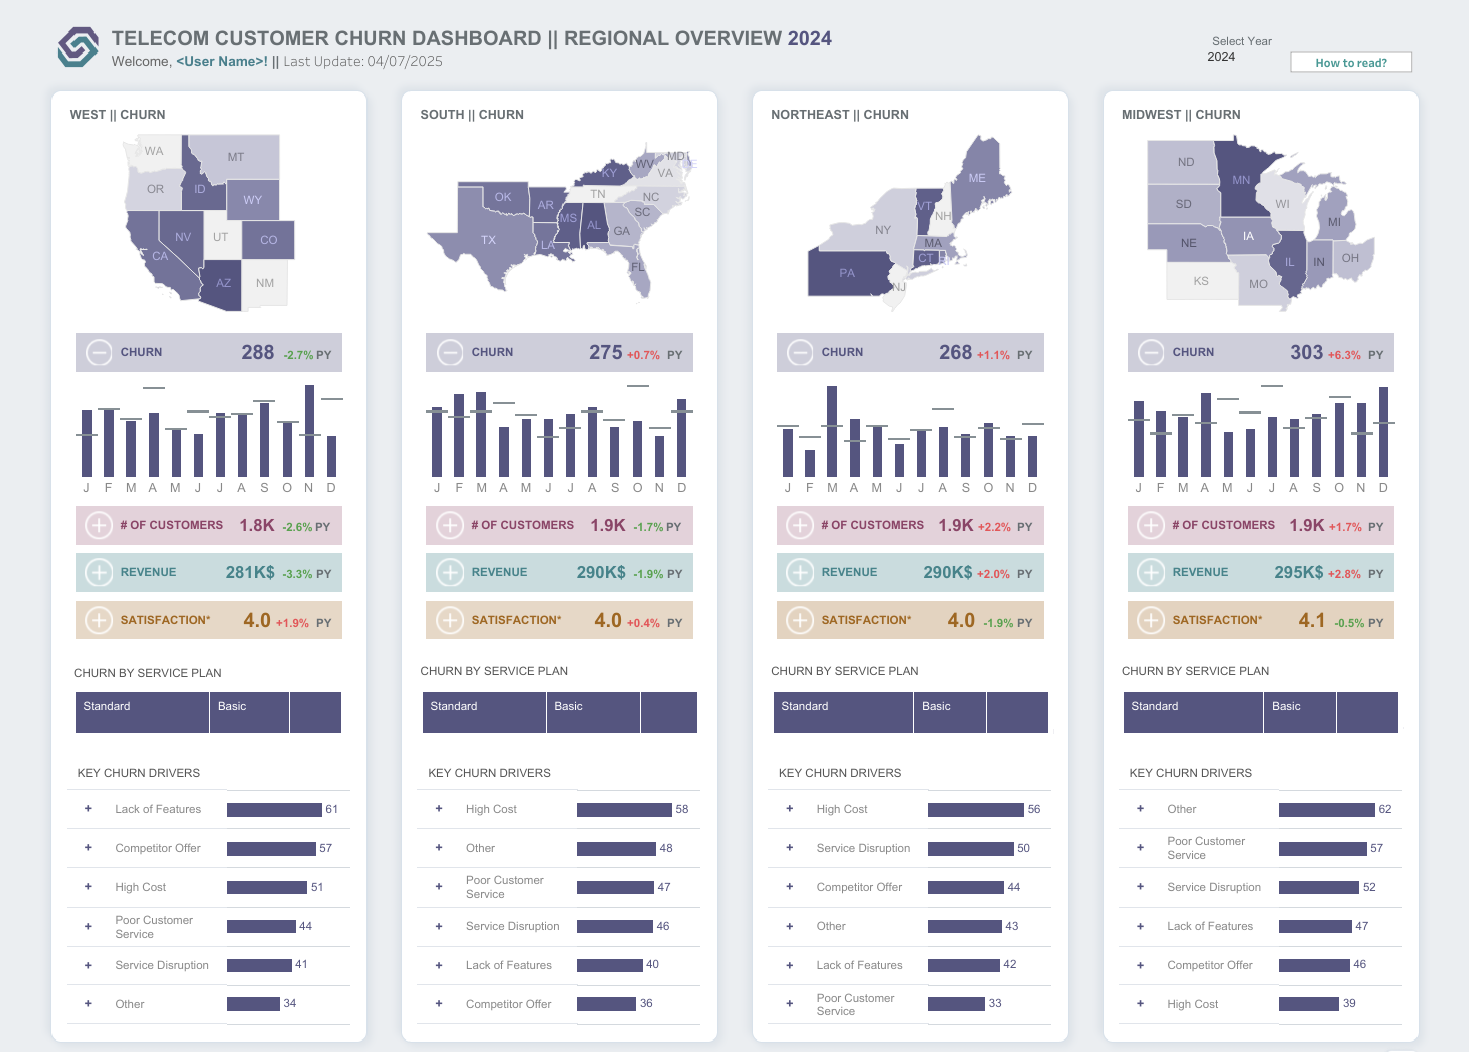
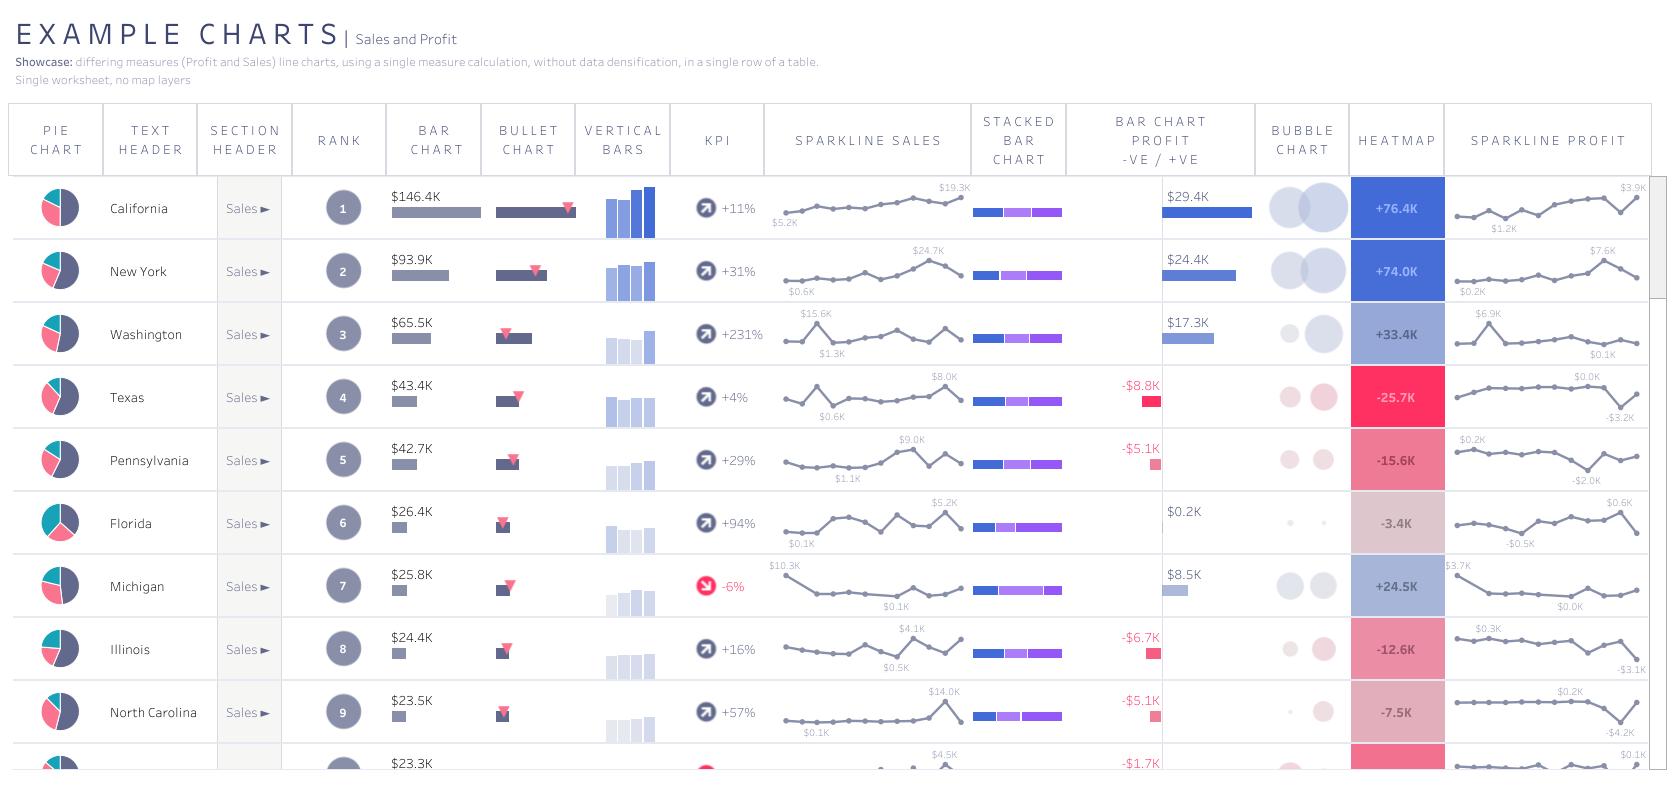
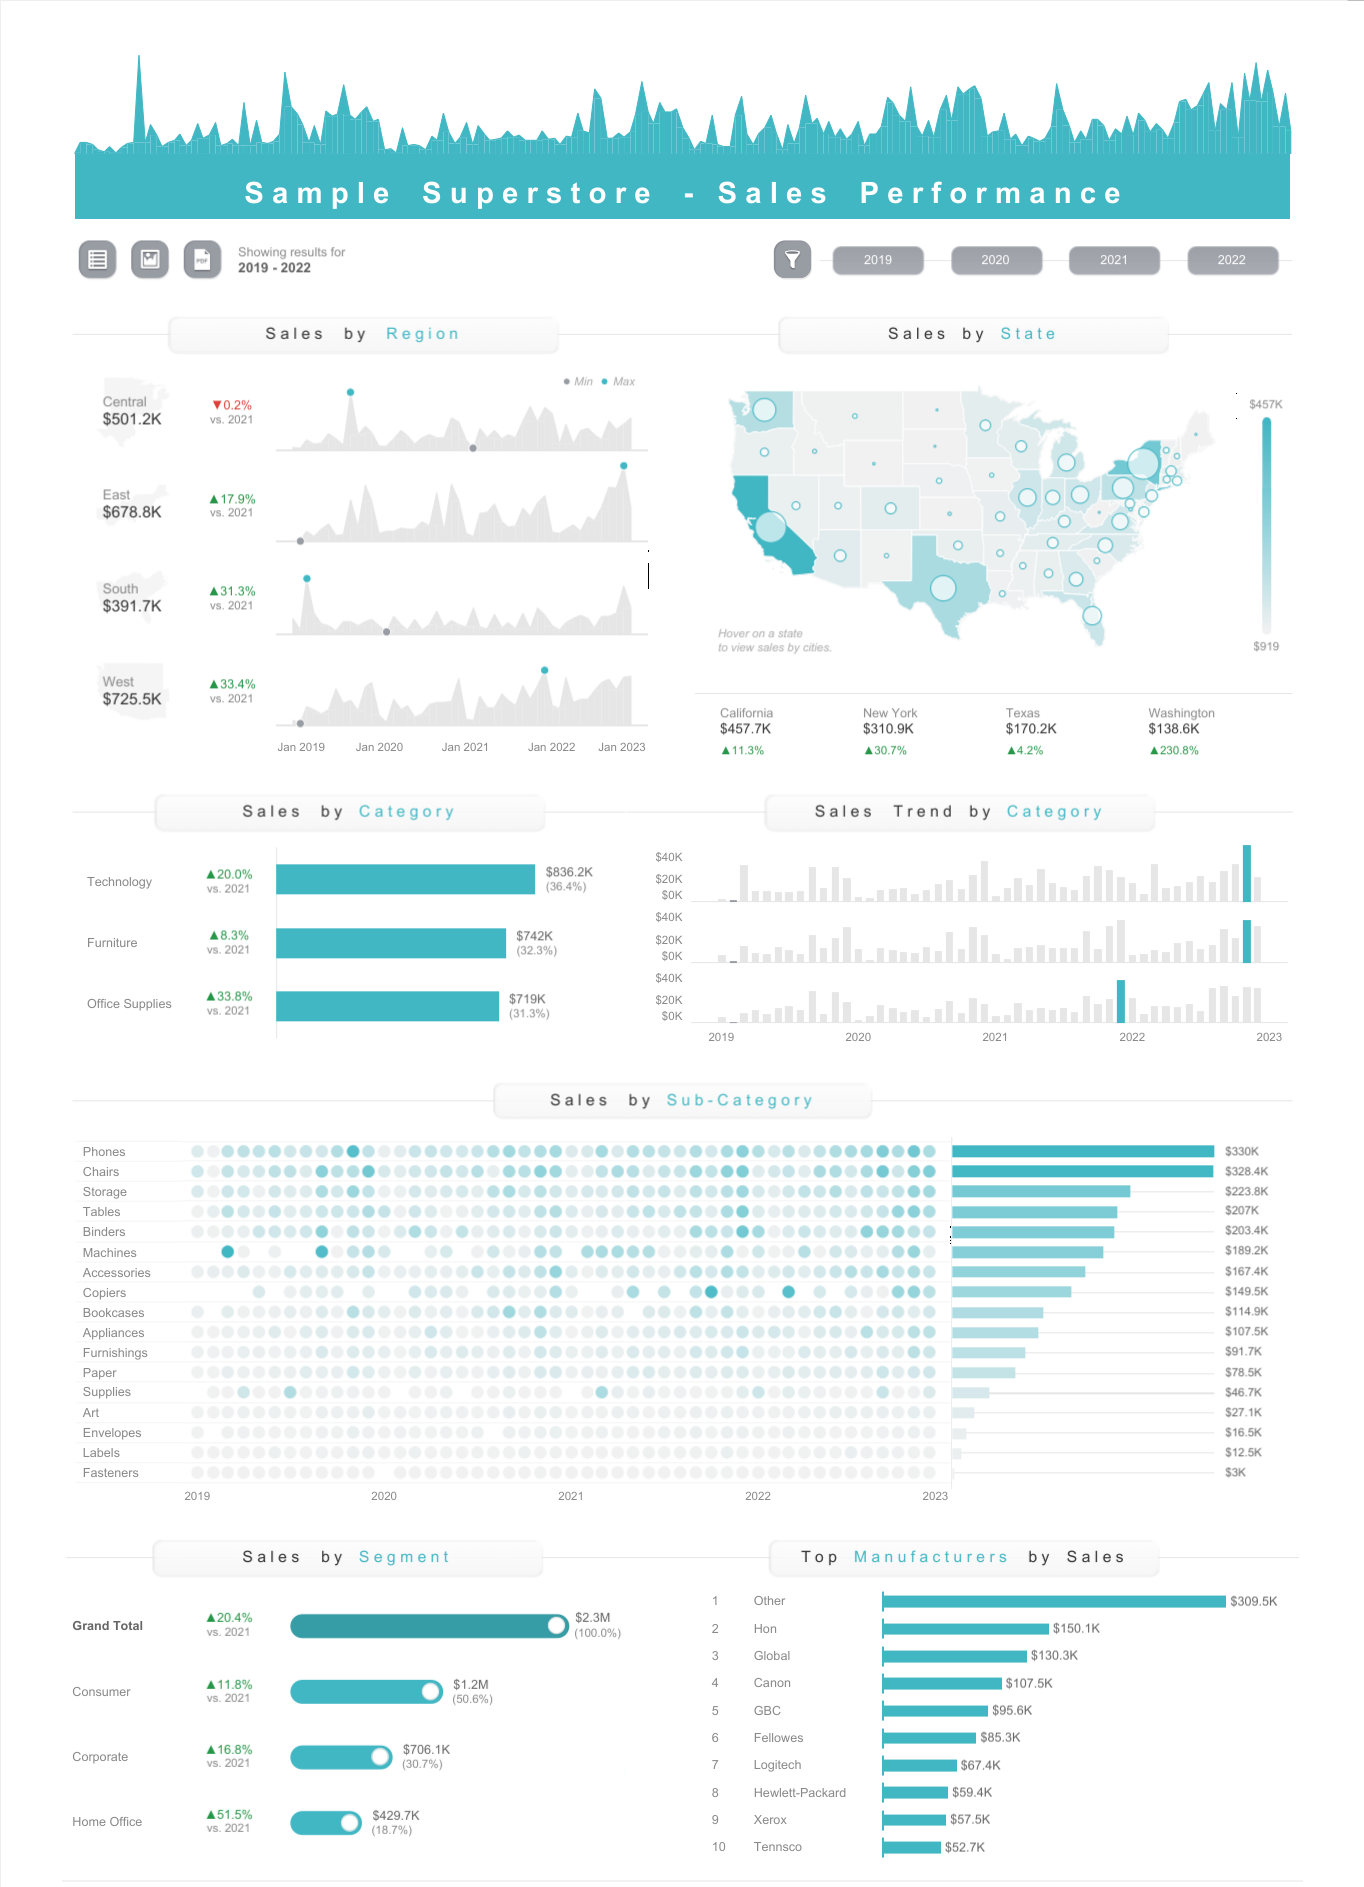
A Closer Look at Live KPI Dashboards
Explore examples of live KPI dashboards that help organizations monitor performance continuously, detect issues earlier, and act with greater speed and confidence.
From Data Streams to Clear Business Insight
Live KPI dashboards do more than display performance. They help organizations see issues earlier, align teams around the same metrics, and act before small problems become larger business risks.
That is what makes real-time visibility valuable: it improves not just reporting, but the speed, confidence, and quality of business decisions.
From Visibility to Better Decisions
Explore how TDT designs live KPI dashboards that help organizations monitor performance continuously, detect issues earlier, and act with greater confidence across the business.